
Challenge
Energy data is dense and fragmented
Operators read generation, storage, consumption and grid prices across different systems. Dense charts and tables are necessary, but they compete for attention and make exceptions hard to spot.
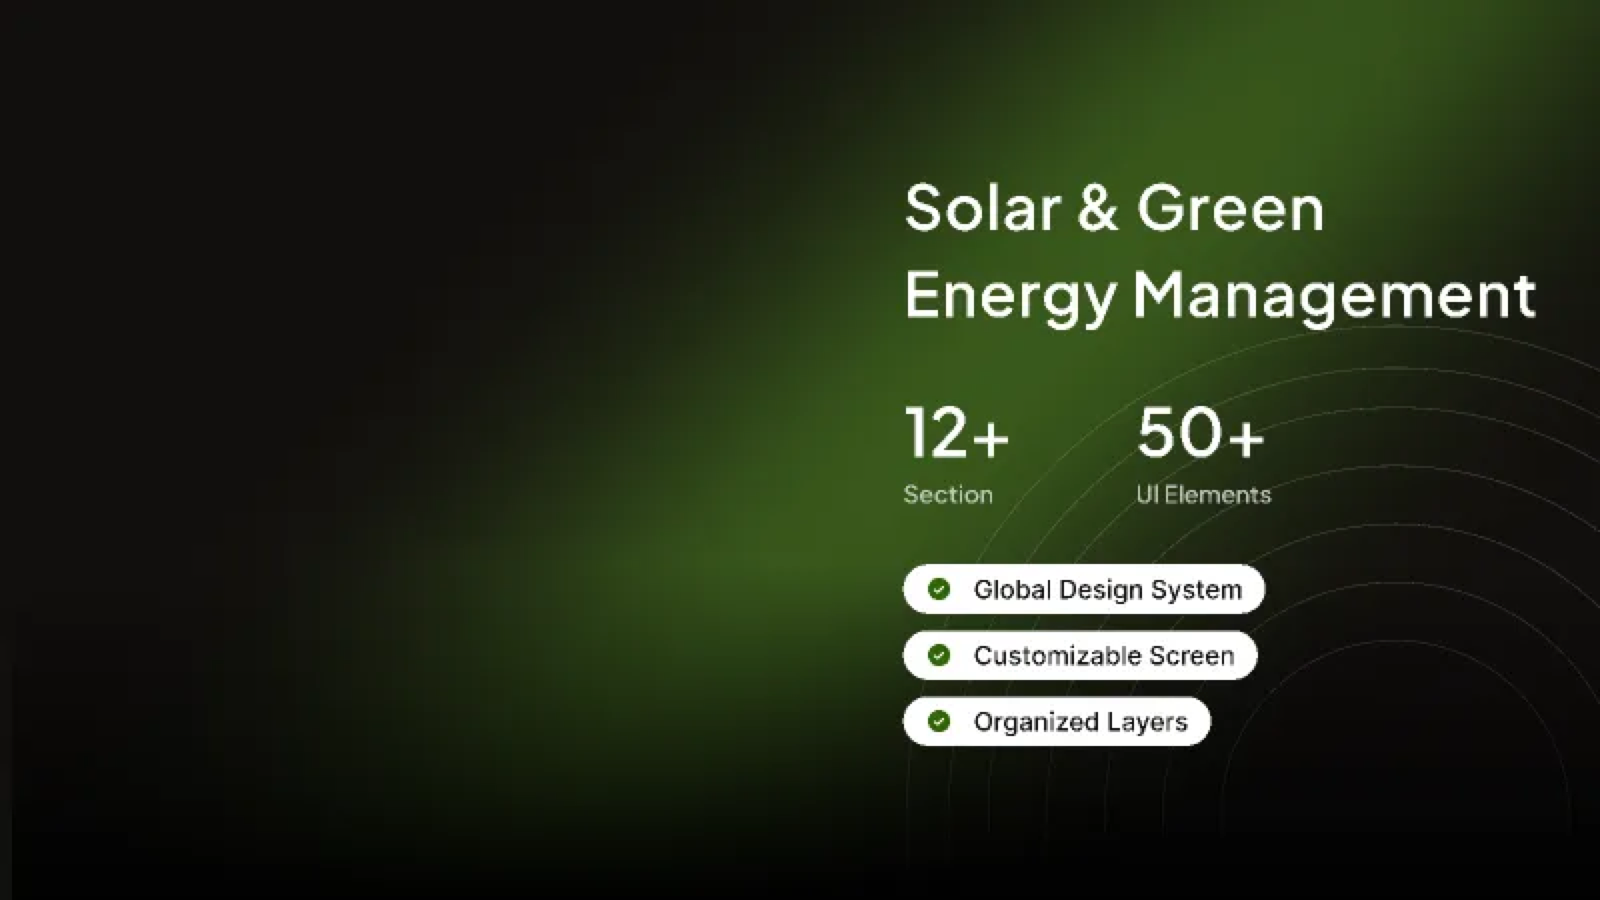
Solaris is a solar and green energy management concept: a modular set of screens and a shared design system for monitoring generation, storage and consumption across a mixed portfolio of solar and wind assets.
The system covers more than twelve sections and fifty UI elements — from portfolio dashboards and asset detail views to alerts, reporting and settings — built on one global design language so new screens can be assembled quickly without losing consistency.
One calm interface for a complex energy mix.
Challenge
Operators read generation, storage, consumption and grid prices across different systems. Dense charts and tables are necessary, but they compete for attention and make exceptions hard to spot.
Approach
Instead of styling each screen in isolation, Solaris starts with tokens, components and layout rules. Colour, type, spacing, states and data-visualisation patterns are defined once, then reused across every screen.
Key decision
Energy dashboards are often watched for long periods. A deep, low-glare surface keeps charts comfortable, while a single green accent carries status, selection and primary actions — so colour always means something.
The kit is organised in three layers: foundations, components and screen patterns. Everything is built from the same tokens, which makes global changes — a new green ramp, a denser table row, a different card radius — a single edit rather than a screen-by-screen rebuild.
Screens are composed from the same grid and card language. Dashboards lead with a small set of headline numbers, then move into trend charts and tables; detail views keep context visible while drilling into a single asset. Charts use a limited palette, direct labels where possible, and clear empty and loading states.
The layouts are responsive by construction: KPI groups reflow from four columns to two, tables switch to stacked rows on narrow screens, and charts keep a readable minimum height rather than shrinking without limit.
Overview
Generation, storage and consumption summarised in one view, with exceptions surfaced before detail.
Detail
A single solar or wind asset with output history, status, maintenance notes and contribution to the portfolio.
Operations
Filterable alerts, acknowledgement states and exportable reports built from the same table system.
Customisation
Cards and sections can be rearranged per role, using the same component set and spacing rules.
Walk the screens in Figma. The prototype covers the main Solaris frame and the surrounding section library.
The result is a reusable product kit rather than a single set of mockups: twelve-plus sections and fifty-plus UI elements that share one visual language, organised layers for handoff, and screen layouts that can be customised without breaking the system.
It is a foundation for a green-energy product — ready to extend with live data, new asset types and role-specific views.
Outcomes, figures, and quotes on this page are illustrative or were provided by the client and have not been independently verified.
Have a similar project in mind?
Start a project